Using SmartArt in PowerPoint 2010
Synopsis
In this article we look at how to use SmartArt in PowerPoint 2010. We add SmartArt to a slide then customize it to our specific requirements.
SmartArt was introduced in PowerPoint 2007. It has proved to be a very popular and flexible way of including graphical elements in a presentation. It is particularly used for elements that represent processes, links, relationships and hierarchies.
The general approach is to add one of the many “standard” examples of SmartArt and to then customize is to your specific requirements.
Let’s suppose that you want to add a graphic to a presentation on the US Government that shows the relationships between the main tiers of government. Amongst the SmartArt graphics within PowerPoint 2010 there are several that show hierarchies. Let’s use on of the those to build up a picture of the structure of government.
Here is the starting slide.


Select the Insert tab on the ribbon. In the Illustrations group select SmartArt. You will see the Choose a SmartArt Graphic dialog.


The list on the left shows the SmartArt categories that are available. If you click on each in turn you will see pictures of the various options in the center panel. Select Hierarchy.


There are 11 options available. Let’s choose the first one. Select it, then click OK.


The graphic is inserted with default contents. There is a single shape at the top – this will represent the US Government itself – and then there are subordinate shapes, which will represent the various tiers, organizations and departments.
The SmartArt graphic is in a frame. You can see the border of the frame above. To make the graphic bigger, grab one of the frame’s sizing handles with the mouse and drag it as required. Here I’ve made it much bigger.


One very important feature of SmartArt graphics is that they resize themselves dynamically as you work on them. When I made the frame bigger, the individual boxes automatically made themselves bigger to make better use of the increased space available. In addition, the font size of the text in the boxes also increased.
However, the elements of a SmartArt graphic will make themselves smaller as well if they need to.
Now type “US Government” in the top box. To do this, click on the word “[Text]” and you will see the cursor appear in the middle of the box. Then just type. You don’t need to change the font size to fit all of the text in as Excel 2010 will progressively reduce the font size as you type to make sure it all fits.


There is a single box below and to the left of the top one. In normal circumstances this position in a hierarchy indicates an “assistant” type of role, but we don’t need it here. Click on the edge of the box (not in “[Text]”) so that it is selected and then press the Delete key. The box is deleted and the SmartArt Graphic resizes itself again.


At the next level of government we have Legislative, the Executive and Judicial. Type each of those in one of the boxes at the second level.


Now let’s start to add the next level of government. Right click on the “Executive” box, hover over Add Shape and a fly-out menu appears.


This is how we add shapes to our graphic. In this case, select Add Shape Below. The “below” refers to position in the hierarchy, although in general it also indicates where the shape will be drawn on the graphic as well.


There is no “[Text]” prompt here, so right click on the new empty box and select Edit Text… from the shortcut menu. Type “President”.


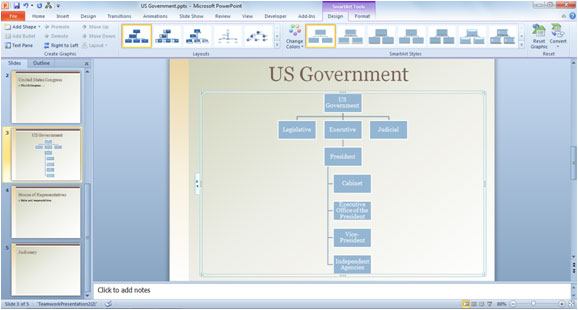
In this way you can see how the hierarchy is built up. To add the next level from the President, select the “President” box four times and in each case add a shape below it. Add the relevant text as shown below.


To complete the hierarchy diagram (organizational chart) you would add the relevant detail to the Legislative and Judicial arms of the chart.

