Using Reports with Microsoft Project 2013
Synopsis
In this article we look at reporting in Project 2013. The facilities provided constitute a major change from earlier versions of MS Project.
In Project 2013 the reporting facilities have undergone a major overhaul. Standard reports now have more visual appeal, and the customization features have been significantly improved.
The Report tab on the ribbon includes the View Reports group.


The standard reports are categorized into Dashboards, Resources, Costs and In Progress, although if you select any of these options you also have access to More Reports… .


Selecting the More Reports… option causes the Reports dialog to open.


From this dialog you can not only access the standard reports but also any reports you have created or customized yourself. You can also use the Recent option to return to the reports you have used most recently. Recently accessed reports also appear in the menu when you select Recent in the View Reports group on the Report tab.
The Getting Started option provides access to some useful facilities, including the Best Practice Analyzer that can identify potential issues with your project, such as tasks to which no resources have yet been assigned.
To create a New Report select that option from the Reports dialog.


You can choose to start with a Blank report or with a report containing a Chart, a Table or a Comparison. However, there is plenty of flexibility when designing a report to add additional elements later or to change your mind about what to include.
Let’s look at an example. Suppose that you select the option to create a new report based on a chart. You are first asked to enter a name for the report. In this example I entered a report name of TA Cost Report. Project 2013 created a report with this name and some default content, including this chart.


By default this chart is selected when the report is first created, and there are two sets of contextual tabs on the ribbon:
• The Report Tools Design tab provides commands and options to work on the design of the report.
• The Chart Tools Design and Chart Tools Format tabs include facilities to customize the chart. These are visible whenever a chart is selected.
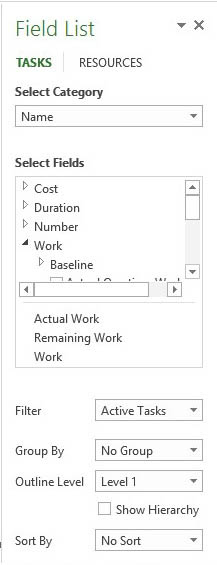
On the right is the Task Pane.


Here you can customize the selection of fields for either tasks or resources in the selected chart. It is also possible to apply a filter to the selected data, or to change the sorting or grouping of the data. Selecting the correct Outline Level here is important as it ensures that your report is operating at the required level of granularity of project information.
To add additional elements to the report, select the Report Tools Design tab and use one of the options in the Insert group. Apart from the ability to include additional charts or tables, you can add images, shapes or text boxes to further improve the usability and appearance of your report.
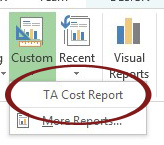
Once you’ve created or customized a report, it will appear in the Custom category in the Reports dialog, and you will also see custom reports appearing in the menu when you select Custom from the View Reports group on the Report tab.


